Exponential Distribution - Hazard Plotting
|
Exponential Distribution - Hazard Plotting |
|
The following section describes hazard plotting for the exponential distribution using the Reliability & Maintenance Analyst. The manual method is located here. Hazard plotting is an excellent method for determining goodness-of-fit. To determine the goodness-of-fit click the "Plot" button. If the plotted points form a straight line, the distribution provides a good time to fail model for the data. To estimate the parameters of the exponential distribution using hazard plotting, follow these steps:
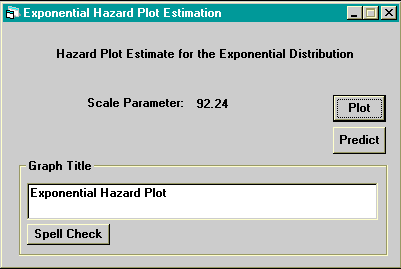
The figure below shows the exponential hazard plotting screen using the data in the file "Demo2.dat".
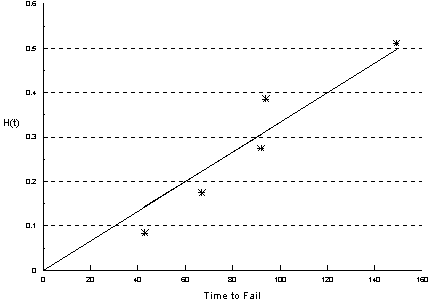
Clicking the "Plot" button gives a hazard plot. If the plotted points do not follow a straight line, the exponential distribution with the estimated parameters does not provide an adequate time to fail model. The untransformed option plots the cumulative distribution function against time. This is useful for determining the probability of failure at a given time. The title of the graphs can be changed by editing the text in the Graph Title frame. To check the spelling of the title, click the "Spell Check" button. To predict reliability or time-to-fail using the estimated parameters use the Predicting Module.Manual Hazard Plotting The exponential cumulative hazard function is H(x) = x/q If a data set is exponentially distributed, a plot of the exponential cumulative hazard function yields a linear fit with a zero intercept and a slope of 1/q . To construct a hazard plot, an estimate for H(x) is needed. The cumulative hazard function is estimated by the cumulative of the inverse of the reverse ranks. For a data set of n points ordered from smallest to largest, the first point has a rank of n, the second n-1, etc. Example 43, 67, 92, 94, 149 Solution
Click here to download this example in Microsoft Excel.
|