Exponential Distribution - Probability Plotting
|
Exponential Distribution - Probability Plotting |
|
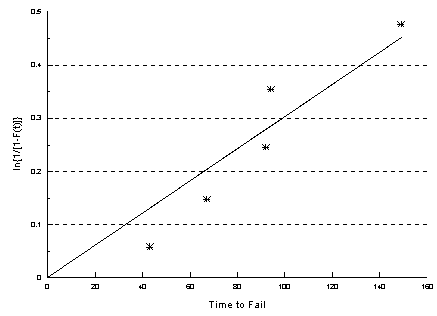
The following section describes probability plotting for the exponential distribution using the Reliability & Maintenance Analyst. The manual method is located here. Probability plotting is an excellent method for determining goodness-of-fit. To determine the goodness-of-fit click the "Plot" button. If the plotted points form a straight line, the distribution provides a good time to fail model for the data. To estimate the parameters of the exponential distribution using probability plotting, follow these steps:
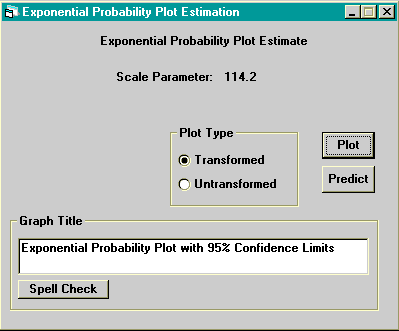
The figure below shows the exponential probability plotting screen using the data in the file "Demo2.dat".
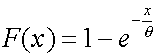
Clicking the "Plot" button gives a probability plot. If the plotted points do not follow a straight line, the exponential distribution with the estimated parameters does not provide an adequate time to fail model. The untransformed option plots the cumulative distribution function against time. This is useful for determining the probability of failure at a given time. The title of the graphs can be changed by editing the text in the Graph Title frame. To check the spelling of the title, click the "Spell Check" button. To predict reliability or time-to-fail using the estimated parameters use the Predicting Module.Manual Probability Plotting The exponential cumulative distribution function is
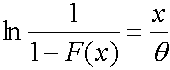
By manipulating this expression algebraically this expression can be transformed to a linear format
If a data set follows an exponential distribution, a plot of ln[1/F(x)] versus x will be linear with a zero intercept and a slope of 1/q . Before a plot can be constructed, an estimate for F(x) is needed. The cumulative distribution function, F(x), is usually estimated from the median rank, but other estimates such as the mean rank and the Kaplan-Meier product limit estimator are also used. Example 43, 67, 92, 94, 149 Solution
Click here to download this example in Microsoft Excel.
|