Parameter Estimation Techniques
|
Parameter Estimation Techniques |
|
Maximum likelihood estimation Maximum likelihood is the most widely used method generating estimators. It is based on the principle of determining the parameter(s) value(s) that maximize(s) the probability of obtaining the sample data.The likelihood function for a given distribution is a representation of the probability of obtaining the sample data. Let x1, x2,...,xn be independent, random variables from the probability density function f(x,q), where q is the single distribution parameter. Thenis the joint distribution of the random variables, or the likelihood
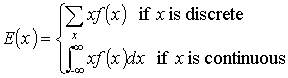
function. The maximum likelihood estimate, The variances of the estimates can be found by inverting the matrix of the negative of the second partial derivatives of the likelihood function, also known as the local information matrix. These estimates are asymptotically normal and the variances obtained from the local information matrix are used to calculate confidence intervals. Hazard plotting Hazard plotting is a graphical method of parameter estimation. The cumulative hazard function is transformed to a linear expression, usually by a logarithmic transformation, and plotted. The slope and the intercept of the plot provide the information needed to estimate the parameters of the distribution of interest.If manually constructing a hazard plot, distribution-specific hazard paper is required. By using hazard paper, the failure times and cumulative hazard function estimates can be plotted directly. With the power of personal computers and electronic spreadsheets, specialized graph paper is no longer needed, as the necessary transformations can be made quickly and easily. Probability plotting Probability plotting is a graphical method of parameter estimation. For the assumed distribution, the cumulative distribution function is transformed to a linear expression, usually by a logarithmic transformation, and plotted. If the plotted points form a straight line, the assumed distribution is acceptable, and the slope and the intercept of the plot provide the information needed to estimate the parameters of the distribution of interest. The median rank is usually used to estimate the cumulative distribution function, although there are several alternatives such as the mean rank and the Kaplan-Meier product limit estimator.If manually constructing a probability plot, distribution-specific probability paper is required. By using probability paper, the failure times and cumulative distribution function estimates can be plotted directly. With the power of personal computers and electronic spreadsheets specialized graph paper is no longer needed, as the necessary transformations can be made quickly and easily. Moment estimation Moment estimation is based on the concept of matching the moments of the sample data with the moments defined by the distribution of interest and its parameters. The first moment about the originis equal to the distribution mean. The second moment about the mean is equal to the distribution variance. 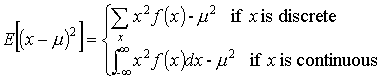 where m is the distribution mean.
For some distributions, such as the normal distribution, these moments provide direct estimates of the parameters. For other distributions, such as the Weibull, lognormal and gamma, distribution parameters are estimated by setting the sample moments equal to the theoretical moments and solving for the distribution parameters. The number of moments needed is determined by the number of parameters being estimated. If the distribution has one parameter, this parameter can be estimated by setting E(x) equal to the sample mean and solving for the parameter. If three parameters are being estimated, three equations are required. The distribution skewness, which is the third moment about the mean, is used with the two equations given above. Comparison of estimation methods Maximum likelihood estimation is more accurate than either hazard plotting or probability plotting, especially when sample sizes are small and when the data are heavily censored. Maximum likelihood estimation provides no indication of goodness of fit, thus it is recommended to verify the fit of the chosen distribution with either a hazard plot or a probability plot, then use maximum likelihood estimation for all inferences concerning the population.
|