Engineered Software

Predicting Reliability & Time to Fail


Techniques

Cumulative Distribution Function

Cumulative Hazard Function

Weibull Distribution

Normal Distribution

Lognormal Distribution

Exponential Distribution

Exam

Engineered Software Home Page

Determining confidence limits for the Weibull distribution is tedious and computer routines are often employed. Commercial software is available for these calculations, such as the Reliability & Maintenance Analyst.

The Predictions module is provided to allow the user to estimate reliability, with confidence limits, for a single value of time, or to estimate time, with confidence limits, for a single value of reliability. The procedure for conducting these estimates is as follows:

  1. Select the desired distribution from the sub-menu.

  2. Select the desired distribution parameters from the Select Parameters frame.

  3. Position the active cell in the column to be used for user entry (time or reliability).

  4. Enter a value appropriate for the data entry column (time must be greater than zero and reliability must be greater than 0 and less than 1.0). The software will make the desired calculations when the ENTER key is pressed or if the user exits the cell.

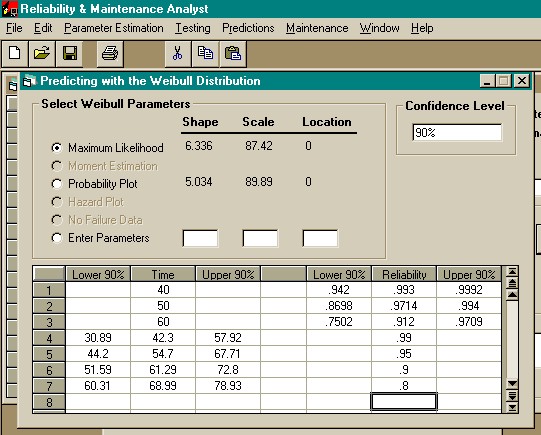
The figure below shows the Predicting screen for the Weibull distribution with data from the file "Demo2.dat."

w_pred.jpg (76962 bytes)

Notice in the figure above, that the parameters of the Weibull distribution had been estimated using maximum likelihood estimation and probability plotting prior to loading the Predicting screen. The confidence level can be changed by editing the value in the Confidence Level frame (Be sure to  press the "Enter" key to change the confidence level.  The confidence level is use is shown in the title bars of the spreadsheet). Changing the confidence level will erase the existing confidence limits. Remember that confidence limits are only computed when using maximum likelihood estimation. The method of parameter estimation can be changed by using the Select Parameters frame. Changing the parameter estimation method erases any existing predictions.

The spreadsheet above can be interpreted as follows:

Row Interpretation
1 The expected reliability at time = 40 is 0.993.  You can be 90% certain that at least 94.2% of the items will survive until at least time = 40 and that no more than 99.92% of the items will survive until time = 40.
2 The expected reliability at time = 50 is 0.9714.  You can be 90% certain that at least 75.02% of the items will survive until at least time = 50 and that no more than 97.09% of the items will survive until time = 50.
4 It is expected that 99% reliability will be achieved at time = 42.3.   You can be 90% certain that at least 99% of the items will survive past time =   30.89 and that no more than 99% of the items will survive past time = 57.92.
7 It is expected that 80% reliability will be achieved at time = 68.99.   You can be 90% certain that at least 80% of the items will survive past time =   60.31 and that no more than 80% of the items will survive past time = 78.93.
 

Home